|
Home
The Cooling Curve
When a solid substance is heated until it is completely melted, and then heated
further and allowed to cool slowly, the curve obtained by plotting temperature
against time is known as the cooling curve.
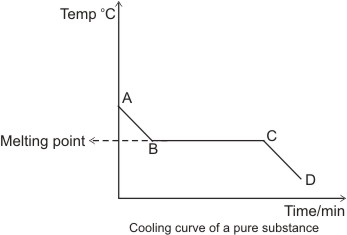
Explanations for the cooling curve above:
Between A and B, the temperature falls with time - there is no change of state,
hence the substance is still in the liquid state.
Between B and C, there is a constant temperature over time. This suggests that
there is a change of state going on from liquid to solid. The heat lost between
these points is
that gained in liquefying the solid substance (latent heat of fusion). Hence,
there is a balance of heat, which explains why there is no reading of
temperature change- this steady
temperature is the melting point of the substance and the section, B and C
represents liquid/solid state.
Between C and D, the temperature falls again with time. Here, the substance is
totally in the solid state.
The cooling curve discussed above is that of a pure solid substance. If the
substance were a mixture (i.e. consisting of two or more components), we would
have more than one level of steady temperature. This is because we would have
different melting points for the
different components present. Example:
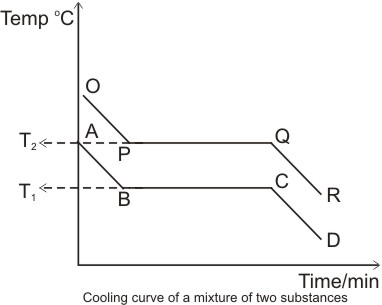
T1 and T2 are the melting points of the two components of the mixture
respectively.
Note: the melting point or freezing point is the temperature at which the solid
and liquid phases of a substance can exist in equilibrium. At this point, the
solid and liquid phases have the same vapor pressure.
|